|
|
|
|
| home Lymm Observatory lightcurves |
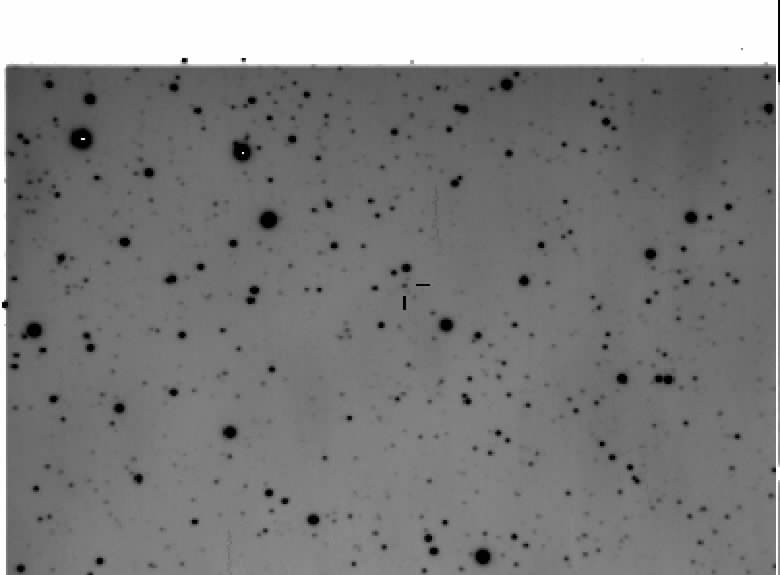
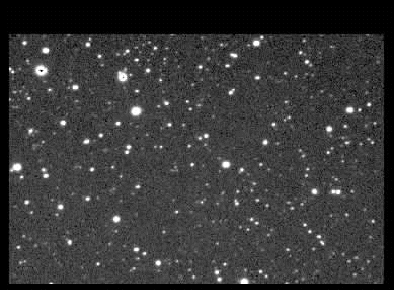
HT Cas, 2005 October 5 (10 kb PDF). Just over one hour of data, including an eclipse. Since this was a very faint object, I have plotted the brightness on a linear scale, relative to an arbitrary ensemble of comparison stars. Here is a stack of all the images in this run, with HT Cas marked, whilst here is an animation (784 GIF).
|
|